Business intelligence (BI) systems are processes and tools for gathering and analyzing data to gain insights about an organization and inform strategic decisions. Effective BI systems are invaluable in higher education, where disparate data centers make it challenging to access an institution-wide or even program-wide perspective for centralized decision-making processes.
Implementing business intelligence solutions at your institution can help administrators harness data from numerous sources to enhance every area of institutional performance, from student recruitment, enrollment, and retention to financial management, faculty success, and accreditation.
Before investing in a cutting-edge business intelligence system for your higher education institution, consider the positive impact you can expect from an effective solution. Leveraging BI can improve every area of institutional performance, including:
The positive impacts of business intelligence in areas like recruitment, retention, and financial forecasting come from the tangible benefits BI solutions unlock for higher education institutions. These benefits arise from innovative software features empowering institutions to know more and do more in less time.
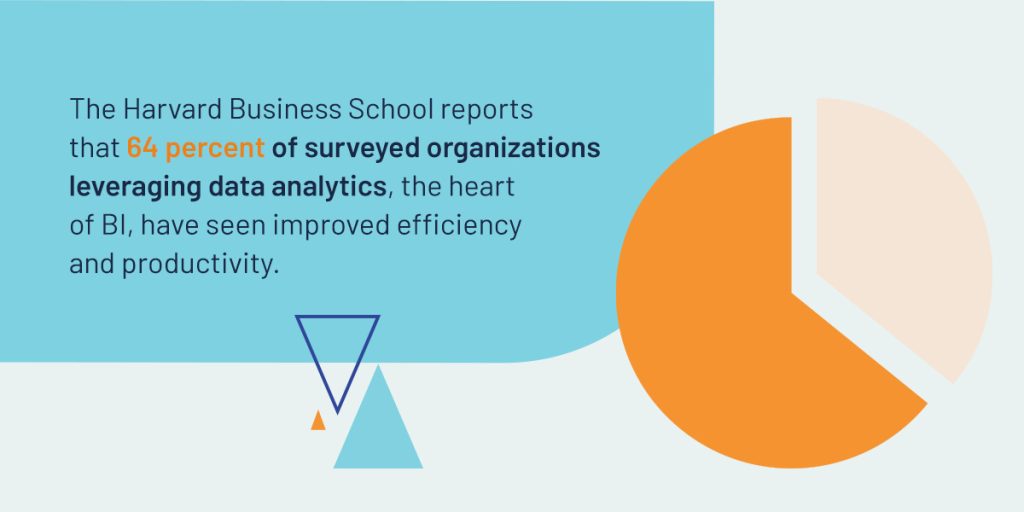
BI solutions can automate potentially time-consuming administrative tasks like data entry and reporting. This frees up your team to focus on high-value activities for institutional performance like strategic planning, student support, teaching, and research. The Harvard Business School reports that 64 percent of surveyed organizations leveraging data analytics, the heart of BI, have seen improved efficiency and productivity.
By analyzing current resource utilization and financial performance KPIs, BI solutions can generate insights to help institutions allocate funds where they will make the greatest impact. BI analysis can also expose areas of overspending or underutilization of available funds to inform budget adjustments. Through strategic financial decisions based on these insights, institutions can manage their budgets and cash flow for financial stability amid economic fluctuations.
BI tools equip teaching faculty with data-driven insights into student performance and engagement. Analysis of student survey feedback, assessment grades, and attendance can help lecturers adapt their lesson plans and teaching methods to improve student satisfaction and academic performance.
Using BI-powered analysis and data reporting, your institution can gain valuable insights into assessment data. These insights include alignment with course objectives and lesson content, common areas of difficulty, and disparities across courses or demographics. Leveraging these assessment data insights, your faculty can develop formative and summative assessments that better support student success and program goals.
BI software pulls back the curtain on student progress in real time. At any moment, faculty can access institution-wide views of student performance metrics or zoom into individual student progress using centralized business intelligence dashboards.
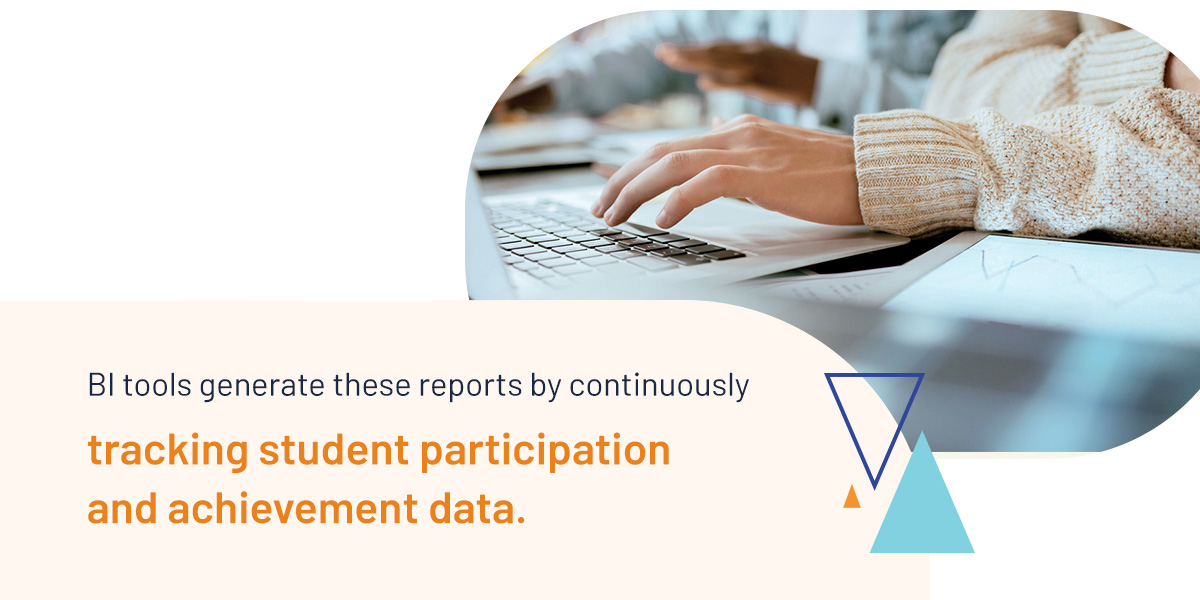
BI tools generate these reports by continuously tracking student participation and achievement data. They can even send automatic alerts to faculty when a student is at risk of falling behind and recommend supportive interventions using predictive and prescriptive analytics.
BI dashboards give administrators and faculty members real-time updates on the KPIs most relevant to institutional goals. These KPIs could include application conversion rates, student satisfaction scores, graduation rates, engagement metrics, and research output.

In higher education, a strategic decision is only as good as the data informing it. Data integration, analytics, and visualization tools in BI software can help administrative leadership make more effective decisions in every area, from curriculum development to marketing and financial planning.
How can your institution unlock improved decision-making with business intelligence systems? You can employ reliable BI best practices that enhance efficiency, personalize student interactions, sharpen recruitment efforts, and enhance student success. Follow these seven steps to bring your institutional decision-making process into line with best practices.
When your institution is faced with an important strategic decision, like how to distribute donated funds across your programs, outline the goals and objectives you intend your decision to achieve. For example, improving graduation rates could be a primary goal.
Once you understand your goals, you can define the KPIs necessary to measure progress toward them. If your institution is aiming for higher graduation rates across all programs, these KPIs will include year-on-year retention, student engagement and satisfaction scores, and average grades. Tracking these KPIs at institutional and program levels will be relevant to your decision.
With your goals and KPIs defined, ask whether your institution has the BI software it needs to track the relevant KPIs. In our example, you would need a software tool kit that can collect and analyze student feedback, enrollment, engagement, and performance data.
If your institution lacks the necessary software or you are unsatisfied with your existing system, explore the available BI solutions. Focus on software designed for higher education contexts with the necessary capabilities to monitor KPIs related to your institutional goals.
Armed with state-of-the-art BI tools, collecting and analyzing data relevant to your decision will be easy. These tools can automate data collection from multiple sources, including attendance records, LMS gradebooks, and online course evaluations. Then, they can employ data visualization, reports, and predictive analytics to show where your key metrics are now and where they are projected to be a year or four from now.
For example, you may find that some programs consistently yield higher grades and satisfaction scores than others. Investigate further, and you may find that some modules within the underperforming programs show the lowest assessment grades, and course evaluations from those modules express dissatisfaction with the teaching methods. These insights could be vital in shaping your funding allocation.

Most major strategic decisions at higher education institutions involve collaboration and stakeholder engagement. This presents an opportunity to consider diverse perspectives regarding how to achieve an institutional goal like improving graduation rates through strategic funding distribution. Centralized BI dashboards give each participant in your decision-making process access to the KPI data they need to make an informed contribution.
With our example goal of allocating funds to improve graduation rates, these contributions could be proposed distributions. In some cases, team members could also consult prescriptive analytics within the BI software for an objective, data-driven view. This combination of collaboration and software-powered analysis brings the best of human perspective and technological innovation to bear on your decision-making process.
After conducting data analysis and collaborating on possible solutions, it’s time to choose, plan, and implement a strategic decision. In our example, your decision may be to invest the bulk of donated funds into professional development within underperforming programs to help lecturers master innovative teaching methodologies for improved student engagement and comprehension.
As you implement your decision, monitor your KPIs to evaluate whether it serves the intended goals. If you invested in innovative teaching workshops to improve graduation rates, look for improvement in student satisfaction scores and grades by the end of the following semester, and improved year-on-year retention after the next academic year’s enrollment cycle. If you see these improvements, your solution is likely successful and should yield improved graduation rates in the long term.
If you do not see the anticipated improvements in your KPIs, you may need to adapt or pivot from your initial decision. In our example, further data analysis can help guide you as you explore whether to adapt your professional development initiatives, focus on other areas of student success and engagement in those programs, or reallocate funds to other programs.
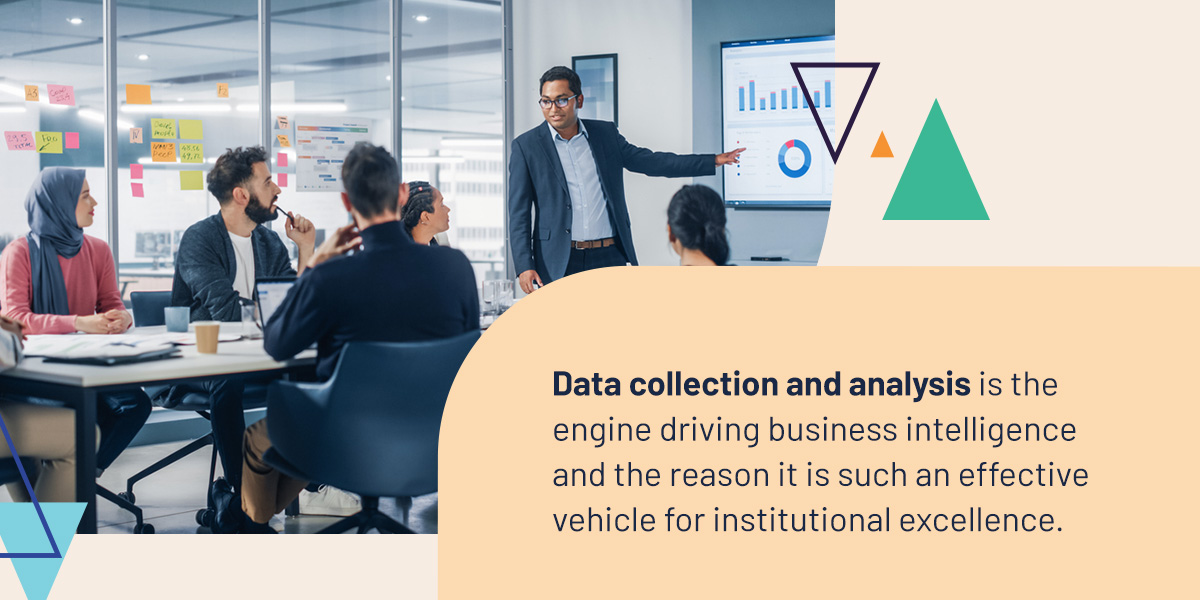
Data collection and analysis is the engine driving business intelligence and the reason it is such an effective vehicle for institutional excellence. Whether your institution is focusing on student outcomes, support services, or diversity and inclusion, the BI solutions you consult to inform your decisions will leverage data collection and analysis to aid you.
Your institution can use BI data analytics to cultivate a more diverse and inclusive campus in several ways, including:
Your institution’s student support services can be the difference between students persisting to achieve their potential and dropping out. However, each student has unique needs in the classroom and beyond, and adapting your support services to meet those needs can help maximize their satisfaction and success. You can leverage BI data analytics to personalize student support through:
Competition for enrollment is heating up, as the coming five years are predicted to see a 15 percent reduction in the number of high school graduates. This means retention is more vital than ever to your institution’s stability. Retention also fuels healthy graduation rates — a key metric for institutional success and prestige.

Strategies for improving retention and graduation rates through BI data analysis include:
As a vehicle for institutional success, BI’s value also derives from its potential to steer crucial data from disparate sources across your institution to a centralized, accessible hub. This integrative capacity lends itself to deeper insights and streamlined decision-making. Several strategies exist to optimize data centralization through BI solutions.
Higher education institutions are complex organizations with data arising from numerous sources across multiple departments and programs. This means data becomes siloed by default, making it challenging to generate a comprehensive view of institutional performance or conduct cross-departmental comparisons and collaborations. BI platforms can solve this problem by integrating data from dispersed locations, provided your team uses your institution’s BI software effectively.
One of the best practices for effective data centralization is to establish a BI team at your institution. How can you set this business intelligence analytics team up for success?
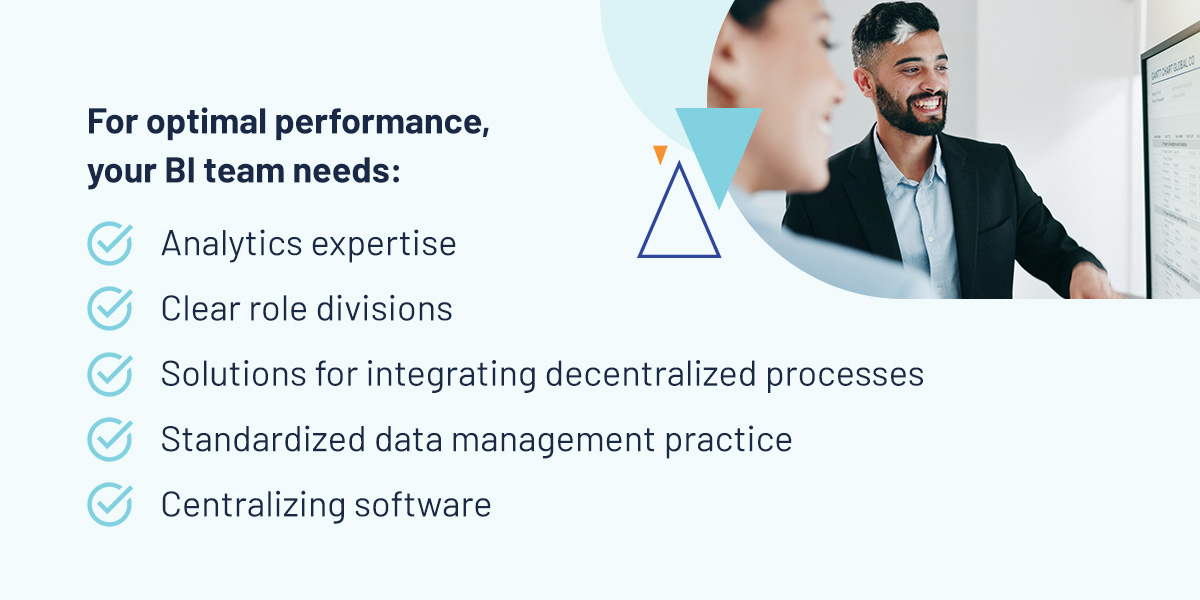
The ideal structure is a centralized team for coordinated, institution-wide analysis, as well as department-specific units staffed by faculty who understand departmental priorities and teaching subjects. For optimal performance, your BI team needs:
Equipped with the right business intelligence tools and processes, your institution can make progress in every area of higher education excellence. As you employ the business intelligence strategies in this guide to achieve your institutional goals, remember these six fundamental best practices:
Applying business intelligence in higher education can help overcome data silos and support strategic decision-making with data-driven insights. Institutions can realize the greatest benefits from BI by investing in solutions optimized for higher education that offer:
Administrators can use these solutions to track KPIs related to institutional goals and inform the strategic decisions that drive excellence. Interested in learning more about data analysis software for higher education business intelligence? Explore how Watermark software solutions can help your institution gain BI insights.