Assessment and accreditation reporting isn’t just about compliance. With the right approach, your assessment process will help your institution more effectively achieve its mission. Rather than setting up a reporting strategy that’s focused on what not to do, a forward-thinking, proactive strategy shows you what you can do to improve and reach your goals. This guide helps you take a step back and revisit the fundamentals of assessment to get a fresh perspective on your measurement and reporting processes.

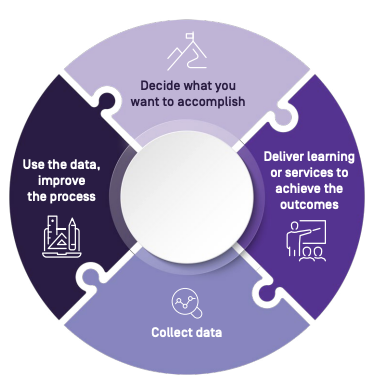
Assessment, in its most basic form, is about measuring progress. To do this properly, institutions must define goals, track outcomes, and analyze the results.
Goals are broad themes, institutional priorities, or general areas of success that directly relate to your institution’s mission. What is your promise to students, faculty, and the community at large? What does your institution intend to achieve in the next three, five, or ten years?
Outcomes state what you want to achieve and how to know when you get there, Academic outcomes specifically track and measure student progress as they move through courses or programs of study
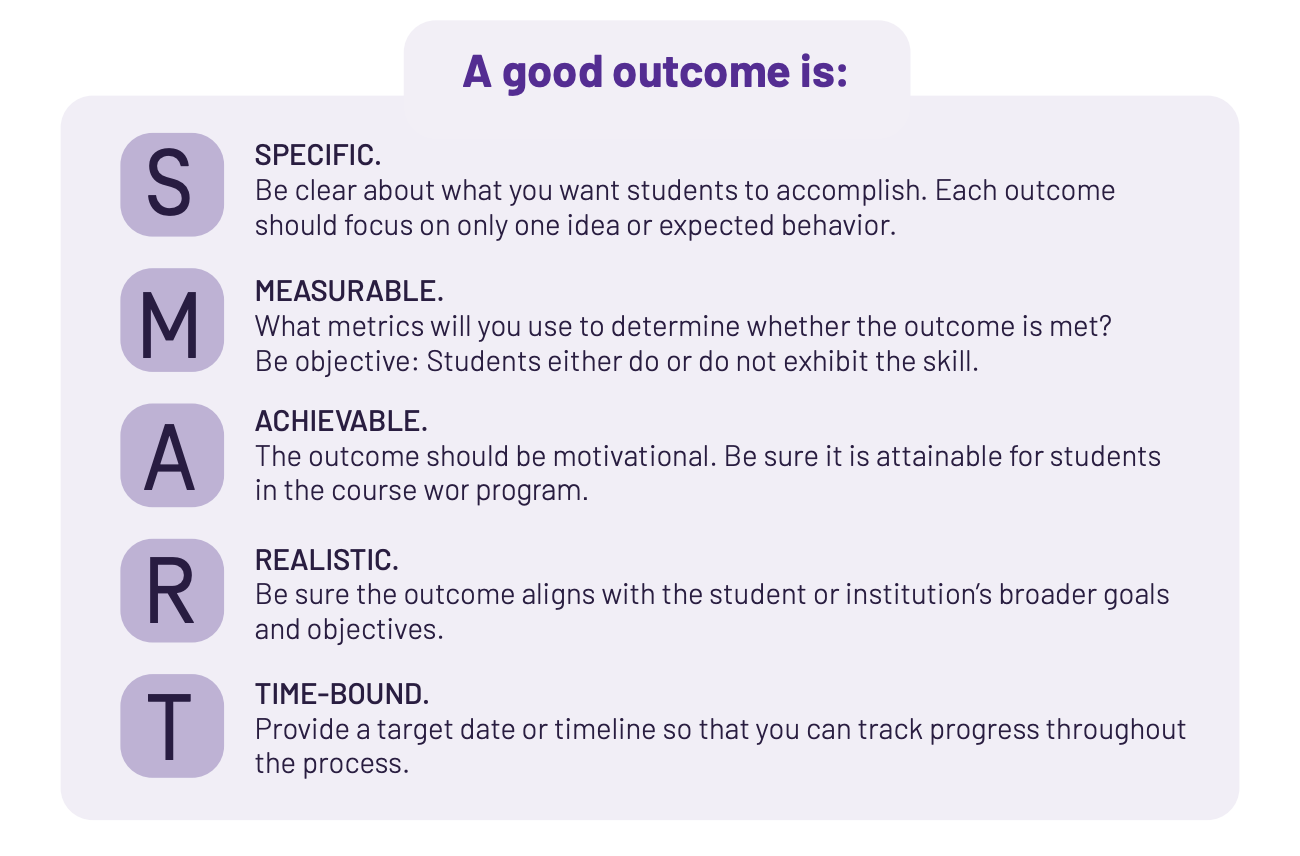
In addition, outcomes should be:
Outcomes for specific academic units and programs should ladder up to broader organizational goals. Remember: the ultimate purpose of tracking outcomes is to demonstrate impact and show progress against institutional goals.
Clear expectations.
The outcomes you expect must be effectively communicated to the individuals responsible for administering them. Are your outcomes clear? Is there any other context or information someone would need to understand before they begin working towards that outcome?
Measurable change.
Are your outcomes easily measurable? Will you be able to look at this outcome and understand how the person has changed, and what the impact of that change will be?
Non-Academic Outcomes While academic outcomes define expected behavior or knowledge that a student will demonstrate after they complete a course or program, non-academic outcomes focus on skills and accomplishments outside of student learning. Every unit at your institution should have a list of outcomes that tie back in some way to your institution’s mission statement, and non-academic units are no different.
Operational or service outcomes tie back to ongoing administrative activities that make learning happen. For example, you could establish outcomes around staff providing or promoting a specific service, or faculty designing coursework connected to employer needs.
Program outcomes reflect the aggregate effect of a program, or how the institution is better because the program exists. This could be centered around student satisfaction, retention rates, employment rates for degree completers, or external recognition for the institution.
Success outcomes are used to measure performance relative to goals, outline how a unit will help the institution achieve its mission, and monitor key metrics. In some cases, if non-academic units interact with students, there could be learning outcomes that link to their work to help demonstrate learning that takes place outside of the classroom.
Non-academic outcomes are similar to key performance indicators (KPIs) because they help you measure the most important work being done at your institution. Tracking these outcomes helps non-academic units prioritize their services and improve their processes, and by keeping a close eye on progress over time, you’ll be able to catch issues before they become major.
Here are some examples of non-academic outcomes that, if met, would make a major impact on your institution:
Success Story: How Montreat College Scaled to Survive In 2012, the warmth of the surrounding small, tight-knit community was reflected in the culture of Montreat College. But the century-old institution was arriving at a painful realization: perhaps its magic came at a cost.
Low student enrollment, dwindling financial resources, and resistance to change had left Montreat College in dire straits. A decade later Montreat College is thriving, partly due to the adoption of Watermark’s assessment tools.
“You hit a ceiling pretty quickly running on the Excel spreadsheets and Word documents and paper files shoved in a box somewhere. That’s where we were. I no longer feel like I’m facing the strain of that since we’ve implemented the Watermark tools,” says Dr. Gratton, Associate Dean and Chair of Business for the school’s College of Adult and Graduate Studies.
“It gives me access — very rapid access — to the data I need to manage and lead.” With quick turnaround on course evaluations, improved processes for faculty review, and a streamlined process for accreditation prep, Montreat College is set up for success for years to come. Read their full story here.

Curriculum mapping offers valuable insights into your programs’ ability to meet specific outcomes by
showing the connections between the expected outcomes of an academic program and the specific courses where this learning is taking place. It also creates a strong foundation for your assessment process so that you know where to look when it comes time to report on progress, and creates a source of clarity and dialogue where faculty can collaborate.
The curriculum mapping process may seem like a lot of extra effort, but it does offer a few significant benefits:
Planning a sequence for instruction. You can identify in which course a student should first be introduced to a concept and in which course that student should be deemed “proficient” – and make sure outcomes are spread out evenly throughout the program.
Identifying gaps in your program. Are all of your learning outcomes covered in the current courses? Is the student’s path to proficiency clear? Better to find that out in the planning stages!
Finding opportunities for assessment. When outcomes are mapped to courses, you can then define how to monitor student progress along the way.
Improving the learning experience. When you are assessing student learning as they move through a program, you can spot negative trends and adjust the program accordingly (for example, adding new courses or modifying syllabi and assignments).
The curriculum mapping process also helps faculty and program chairs better understand how their given course fits into the big picture of their students’ educational experience and define expectations for student growth as they take additional courses. By outlining outcomes introduced in one course and then reinforced in a later advanced course, you can ensure students are developing their knowledge and skills across the curriculum.
In addition, academic chairs are able to confirm that outcomes are being taught throughout the program, while faculty are able to take more responsibility for teaching a specific outcome. It can also help students themselves understand the path they’re on, see how the courses they take will help them achieve their goals, and gain clarity around what is expected of them as they work through the program.
Beyond the Check Mark
The check mark is a simple way to indicate the presence of material, but to take curriculum mapping a step further, use more sophisticated language to indicate the level of depth a student has achieved.
- Covered
- Assessed Introduced -> Reinforced -> Mastered / Emphasized
As you’re working through the curriculum mapping process, try these tips to simplify the process:
Q: How are curriculum maps organized?
A: Some institutions use post-its on a whiteboard to map standards and outcomes to specific courses. A simple table can also work. Watermark Planning & Self-Study streamlines this process for you through pre-made curriculum mapping templates.
Outcomes are not the same thing as measures, but when you’re writing outcomes it helps to have an idea of how you’re going to measure them. Some common learning outcomes include:
The next step in assessment requires collecting data to determine whether an outcome is successfully met. To do this, you must design an instrument that can accurately assess whether a student has achieved milestones within a program or can demonstrate specific skills. The scope of your measurement process can also encompass multiple outcomes.
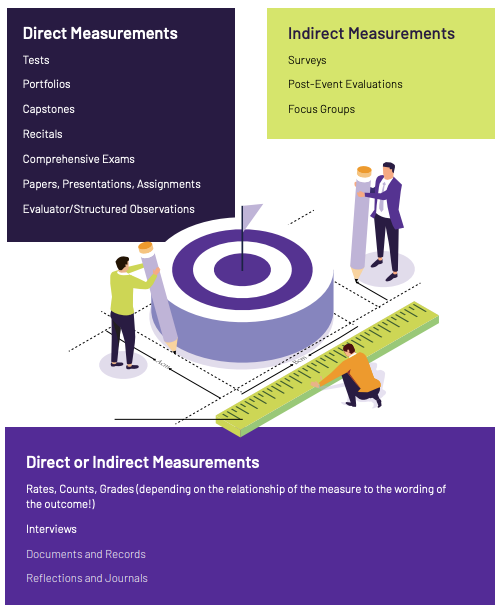
Direct and indirect measures both have a role to play in a successful assessment strategy. Direct
measurements provide actual proof of student learning. They include artifacts like essays, exams, or capstone projects, and are often scored with rubrics. Indirect measurements involve other indicators of success like self-reported surveys, sentiment scores, or final grades that include attendance.
To determine whether to use a direct or indirect measure for the outcome, think about what you’re trying to accomplish and how best to provide sufficient evidence. Assuming it’s possible, do you need to provide tangible proof the outcome is achieved, or is a general indication of success good enough for the audience?
Using a 2:1 ratio of direct to indirect measurements helps ensure that your outcomes are actually being met (and a combination of the two is often required by accreditors!). By looking at both direct and indirect measurements, you’re able to get the full picture – for example, if student surveys reflect that course participants feel they learned something (an indirect measurement) but exam results don’t demonstrate this (a direct measurement), you can take a closer look at the course or program content to figure out what went awry.
When you’re deciding how to measure an outcome, be sure to consider:

Outcome fit: Is the measure appropriate for the outcome? (For example, surveys may be a viable way to measure sentiment, but a test makes more sense for measuring math skills.)
Data type: Is the audience interested in quantitative or qualitative data? Does the volume of responses warrant one over the other?
Timeline: Are you measuring post-experience, pre- and post-experience, or within the experience?
Providing feedback: Do you plan to provide feedback to the person whose work you’re evaluating? If yes, consider formative vs. summative feedback.
Frequency of data collection: How often are you gathering data? (Once per term, once per year, every other year, or less often?)
Methodology: Do you need to create a new tool, adapt a tool, or purchase a tool to make measurement possible?
Set a Target
If 75% of students got 3 out of 5 on a rubric, is that good or bad? Determining what you want to measure is the first step. Next, you have to set clear targets for performance against outcomes. This is similar to having a hypothesis in a scientific experiment: if you aren’t working toward a goal, you won’t know when you’ve hit it. Establishing a benchmark also creates context and helps set expectations, which in turn makes it clear when adjustments are needed (and what they should be).
There’s a time and a place for all of these!
Keep your goal in mind
The goal of assessment isn’t to overhaul your programs or curriculum (although that can happen). Your goal is to make sure your institution is achieving its mission. Don’t worry about getting too granular in your measurement efforts; instead, focus on measuring the most important things first – what matters most to your institution and your students.
Evolve measurements over time
Ideally, your measurements will stay as consistent as possible each term so that you can gather longitudinal data and analyze trends. But it’s also important to consistently evaluate your measurement strategy to make sure you’re collecting the best possible data. Pay attention to results and action items from the measure, and if you’re seeing issues, consider making a change.
Eliminate bias
Figure out the best way to measure how students are performing, and create clear definitions of success. Rubrics are very helpful in reducing subjectivity in scoring, and you don’t have to start from scratch in developing your own. Find out how other institutions analyze similar programs and adapt their rubrics to meet your needs.
Create consistent instruments
Spend the time up front to create centralized assessment instruments so that expectations are clear from the start. Clearly define your outcomes and identify objective ways to measure progress and results with validity and reliability in mind.

Share results early and often
By circulating assessment data widely (and frequently), faculty can see their impact on the assessment process and why their work matters. The valuable insights in these reports help improve course quality, enhance the learning experience, and make it possible to pivot quickly if needed
Don’t overcomplicate it
Curriculum mapping and activity maps help surface the most important courses and artifacts, which are the ones you should pay attention to. By staying focused, it’s easier to create a clear, shared understanding in the organization of what you’re trying to measure and how best to assess student learning.
Make changes strategically
If you’re seeing an area that needs improvement, be thoughtful about adjustments. By measuring the most important items first, you’ll be able to see when an outcome requires more coverage in the coursework or when outcomes need to be adjusted to align with changes outside the classroom (new technology, current events, societal shifts, and the like).
Assessment software for higher education is built based on best practices and accreditor requirements, which means a lot of the heavy lifting is done for you. If you implement the tool and work within its templates and structure, you’ll spend less time designing and managing your process and more time applying the insights that come from the data.
Assessment is more than pulling together vast amounts of data and running standard reports on a regular basis. It’s about taking the information you gather and actually doing something with it. To drive continuous improvement on your campus, you need to dig into the data and act on what it’s telling you.
Preparing for a Data-Informed Discussion
There’s nothing worse than wasting time in meetings, and when you’re striving for continuous improvement, it’s critical that your conversations around assessment data are as productive as possible. Here are three ways to make your data review discussions more effective.
A solid summary
Everyone thinks differently, and graphs and charts don’t work for everyone. Provide a succinct (yet thorough) summary of the assessment data. This enables all of the participants to get an overview in a format that resonates with them so that they can come to the conversation prepared to share insights and discuss next steps rather than spending excess time reviewing the numbers.
A regular review process
Review meetings should take place at least once a year, but everyone on the team should be looking at the data much more often. If you’re looking for faculty to participate in data analysis, find ways to make it easy for them to engage on a regular basis, show them the benefits of making it part of their daily work, and even offer incentives.
The right team
Be sure to invite key decision makers to participate in the discussion, including department chairs and deans. Having the right people at the table not only ensures you’re getting a wide range of perspectives, but it also makes it possible to make decisions and take action when you identify an opportunity for improvement.
The assessment process is a loop. And part of the assessment process is evaluating the process
itself! Consider these questions:
Are our outcomes still appropriate?
Are we collecting data from the right people/ systems/sources?
Are we collecting data at the right time(s)?
Are we collecting data through the most appropriate medium?
Are we collecting data that matches the intent of our outcomes?
Are we able to conclusively determine the degree to which outcomes are met with our data?

See how our tools are helping clients right now, get in-depth information on topics that matter, and stay up-to-date on trends in higher ed.